PANE: Programming with visible data
Abstract
To understand what a data-processing program is doing, a programmer needs to understand the data being processed at each step. However, most programming environments hide all data by default, affording only high-latency views through narrow slits. We present PANE, a prototype live, functional programming environment built around data-visibility. In PANE, the process of constructing a program centers around seeing and acting on concrete data values, all of which are visible by default.
Introduction
In any programming domain, tasks arise which are best described as “data processing”: turning one piece of data into another.
- A scientist wants to turn an experimental dataset into a statistical analysis.
- A sociologist wants to turn census data into a demographic map of a city.
- An artist wants to turn accelerometer data into sound for a dance performance.
- A software developer building a website wants to turn a user’s state into an updated state, based on the user actions.
Functional programmers have benefited from modelling these data-processing steps as pure functions: those which produce new values from old without side-effects. These pure functions can be composed in numerous ways to build up complex processes from simple ones. The execution of a compound process can then be seen as a chain of distinct, concrete values, connected to one another by smaller functions.
This ought to make it easy to visualize the operation of functional-style programs – just show the values at every stage of the chain! But functional programmers have tended to take alternative routes to understanding their programs, with static-analysis tools like type systems standing in for live visibility. So seeing the actual data traveling through a Haskell program, for instance, requires inserting copious trace statements or using a debugger. Neither of these provides fluid, contextualized visibility to the programming process.
We believe that the data-wranglers listed above deserve to see how their data is being processed. In fact, we have adopted the Principle of Radical Visibility: “all data should be visible by default”* * More precisely, this could be stated: "all data at a given level of abstraction should be visible by default, with easy access to lower levels of abstraction". But precision distracts from polemical power.. We are building a prototype called PANE as a straighforward expression of this principle.
PANE is a live, functional programming interface designed for general data processing. It occupies a pragmatic niche between traditional (text-based) functional programming and visual flow-based programming, while focusing on data visibility as the core benefit of moving away from text.
This paper consists mainly of a survey of the PANE features and interface. This survey is centered around examples, which will show how different programs become visible in PANE. Once PANE is described, there will be a short discussion comparing PANE to related work, in the process articulating some of the design decisions that went into PANE. Finally, some future directions for this work are outlined.
The PANE interface
Definitions & inputs
A document in PANE consists of a series of function definitions. Here is the definition of a function which normalizes a vector:

In the left column is the name of the function, as well as a list of inputs to the function. In the right column is the body of the definition. In this case, the body is a single connected graph of nodes, but this is not always the case.
Already we see an important aspect of programming in PANE. The programmer who made normalize provided an example value for the input v. This is the norm in PANE. All programming, even of general functions, is done in the context of specific examples.
The programmer can provide multiple settings for each input, to see how the function responds to different values. These settings are accessible by a pop-up menu. The choice of a different setting is immediately reflected in the live data in the body:

And of course, the numbers in the input (and elsewhere) can be scrubbed:

Graphs, nodes, calls, and references
As mentioned above, the body of this particular function consists of a single graph of nodes. Here’s the graph:

It consists of nodes, like this:

And calls connecting nodes, like this:

This is a call to length, another definition the programmer has written in PANE. This definition can be found elsewhere in the document, but if we are curious how it works, the best way to find out is to expand it in place, using the small plus button:

When the call is expanded, the body of the definition being referenced appears below the call, in the gray box. The inputs to the definition are set to the values used in the call, so that the gray box shows exactly what the called function is doing in this context.
In this case, there are no intermediate nodes in length which might shed light on the computation of the vector’s length. But at least we can see the code that defines the function. The body of length includes a different kind of call: a “code call”, rather than the “definition call” which we just expanded. A code call is defined by a block of code in PANE’s host language, currently JavaScript.

Currently, all PANE programs bottom out in host-language calls. PANE itself does not implement any primitives.
Through explicit, drawn connections, graphs show the flow of data through a program. PANE also allows programmers to use the more conventional method of names to make connections. We have already seen this. The nodes in normalize that look like
have a small token on the bottom showing that they are references to the named node v, one of the inputs to the function. Programmers can also name intermediate values in their definitions. Here is a version of normalize, written so that the length is computed in its own graph:

The somewhat unlikely name how long is used here to illustrate that the choice of names is entirely up to the programmer (and not limited to identifier-ish strings – PANE tries to support a readable, “literate” programming style).
This is the first definition body we have seen with multiple graphs. When a definition has multiple graphs, it returns the value of the last node in the last graph. This return-value node is marked with a blue halo.
Manipulating graphs
The node-and-call structure can be manipulated several ways using a mouse.* * Keyboard-based interactions are likely to be an important future addition for expert use. In particular, calls can be added using a context menu, and nodes and subtrees can be dragged into new locations. This video shows the construction of a small function using these interactions:
Inline code
For very small computations (like extracting the value for a key), a visualization consisting of several boxes and an arrow can be unnecessary and space-consuming. PANE lets the programmer edit the reference below a node, making it into an inline-code node. Here is a more compact and readable version of the construction above, using this feature:

Switches
The discussion so far describes how networks of calls are connected together to make compound functions in PANE. Two additional features give PANE significantly more computational power: switches and array operations. Importantly, both of these have been designed in ways that continue to make the execution of a program radically visible.
A switch in PANE is an if-else.* * They are named "switches" because they are built to support more general n-way pattern-matching in the future. This video shows the construction of absolute value using a switch (as well as a keyboard-based method of linking nodes which has not been shown yet):

The switch consists of a condition block, a block to the right of that which runs if the condition returns true, and a block to the right of “otherwise” which runs if the condition returns false. Each of these blocks supports the operations that a definition’s body supports, including building series of graphs.
Parts of the switch are highlighted or dimmed out to show which code is in operation based on the condition. Note how the programmer in the above video sets x to a negative value to gain access to the “otherwise” block, in keeping with PANE’s principle that programming should always be done in the presence of concrete examples.* * Ideally, the programmer would be able to ask the system to find an example that opens up access to a switched block.
As a more interesting example of the use of a switch, here is a recursive implementation of a factorial function:

By expanding the calls factorial makes to itself, the programmer gets a more concrete understanding of the self-calls go deeper and deeper before bottoming out at a base case:

Array operations
The other powerful feature PANE folds into its data-centric approach is higher-order array operations. Two such operations are supported at present, map and filter. These are “higher-order” because they are parameterized by functions; to map or filter an array, you need both an array and a function to apply to each element, which we will call the per-element function. PANE accomodates this by giving the programmer space to construct a per-element function underneath the call to map/filter. Since building a function in PANE should always be done in the presence of a concrete example, the elements of the input list are used for this purpose.
As a simple example, here is a program to compute the average grade of students in a class (using a utility function _.mean from the JavaScript library Lodash):

Note the “element” and “index” tokens on the map arrow. These can be dragged into the per-element function below the arrow, to create references to the map element and map index.
Arrays in nodes are displayed as columns of values. The value used as the example input to the per-element function below the map is highlighted in purple. To examine the effect of the per-element function on a different value, the programmer hovers over it.

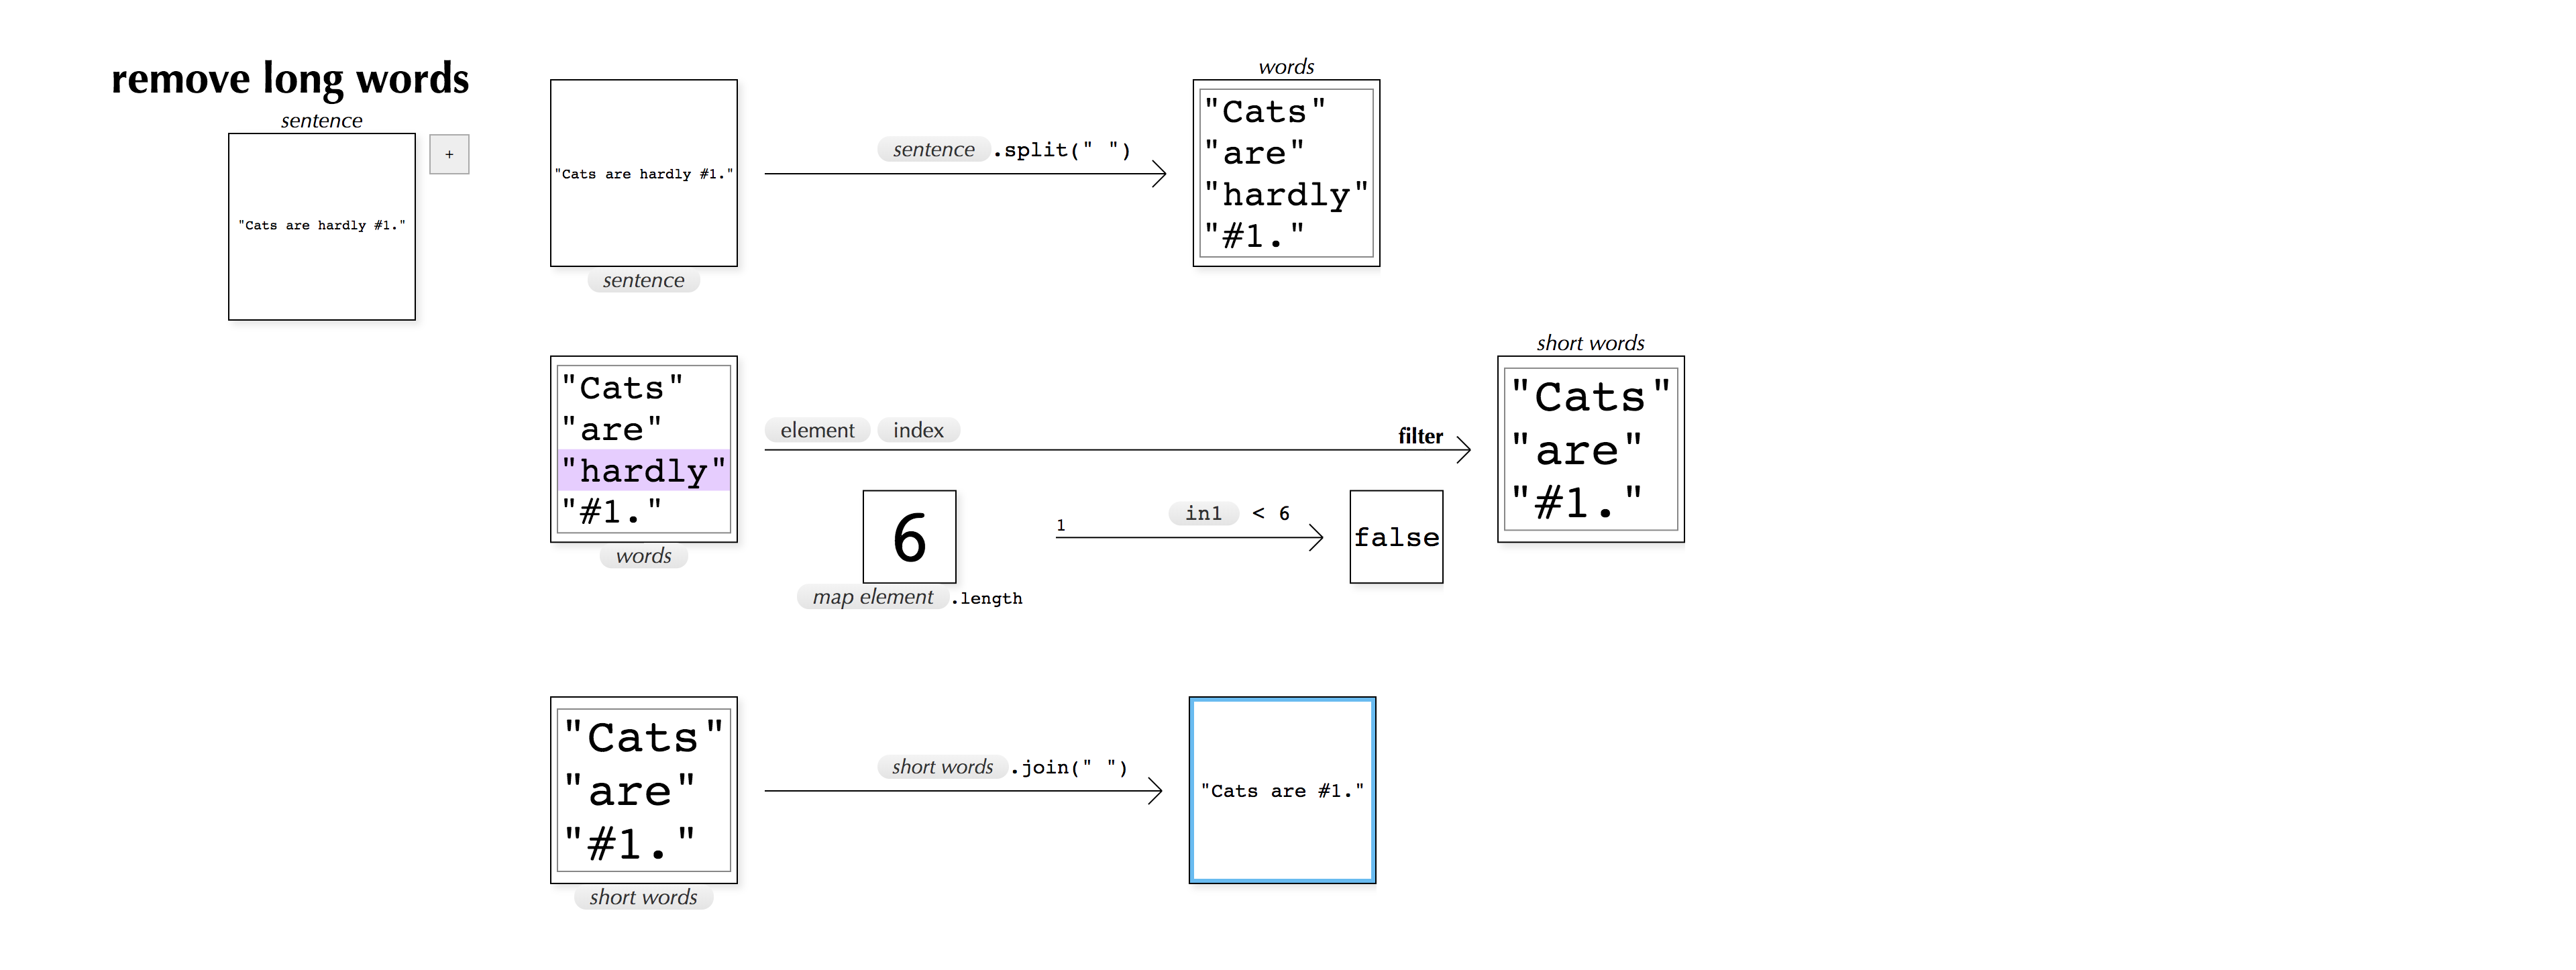
Filtering works quite similarly. Here is a function which simplifies a sentence by removing long words:
And here, in a synthesis of most of the features of PANE described so far, is a recursive implementation of Quicksort:

Graphics and visualizations
In all the examples so far, data in nodes have been represented as raw JSON strings (or columns thereof, in the case of arrays). This takes the principle that “all data should be visible” a bit too shallowly. Not only should all data be visible, but all data should be visible via powerful representations which make the data’s meaning clear and allow discovery of new patterns. The first steps have been taken to move PANE toward this vision of pervasive visualization.
Since visualizations are themselves data, it stands to reason that PANE would be a friendly environment to build them in. Consequently, a functional drawing system was implemented for PANE. This system lets diagrams be represented as data structures which can be manipulated with functions inside of PANE. When PANE sees these data structures, it renders them to SVG, rather than showing the raw JSON beneath.* * Ideally, PANE would give the programmer ways to both levels of representation.
As a simple example of drawing pictures with PANE, here is a circle which grows and changes color as its parameter changes:

This is a PANE definition like any other – it happens to take a number as input and to produce a diagram as output.
What we would really like is to use functions like these as automatic visualizers. Perhaps this growing circle is a useful representation of numbers in general, and any function dealing with numbers would benefit from seeing numbers this way.
PANE supports this, in a somewhat rudimentary way. Any PANE definition can be marked as a “visualizer”. Whenever a value is to be displayed in the PANE interface, it is first run through all visualizers. If a visualizer returns a value, the value it returns (hopefully a diagram) is used in place of a raw JSON string.
The definition above (growing circle) is not quite ready to be a number-visualizer, since it will try to build a growing circle out of any value, not just numbers. But we can wrap it in a check, and set the wrapped version to be a visualizer (marked with the ”📊”):

Upon activating this visualizer, code that once looked like

instead looks like:

This example, of all numbers becoming colored circles, is a fun bit of synaesthesia but not particularly useful. A more useful visualizer, for vectors, is shown below. (This visualizer also serves as a good example of what larger programs can look like in PANE. It uses a feature which has not been explicitly mentioned yet: embedding rendered Markdown between steps of a program, to mark sections or make comments.)
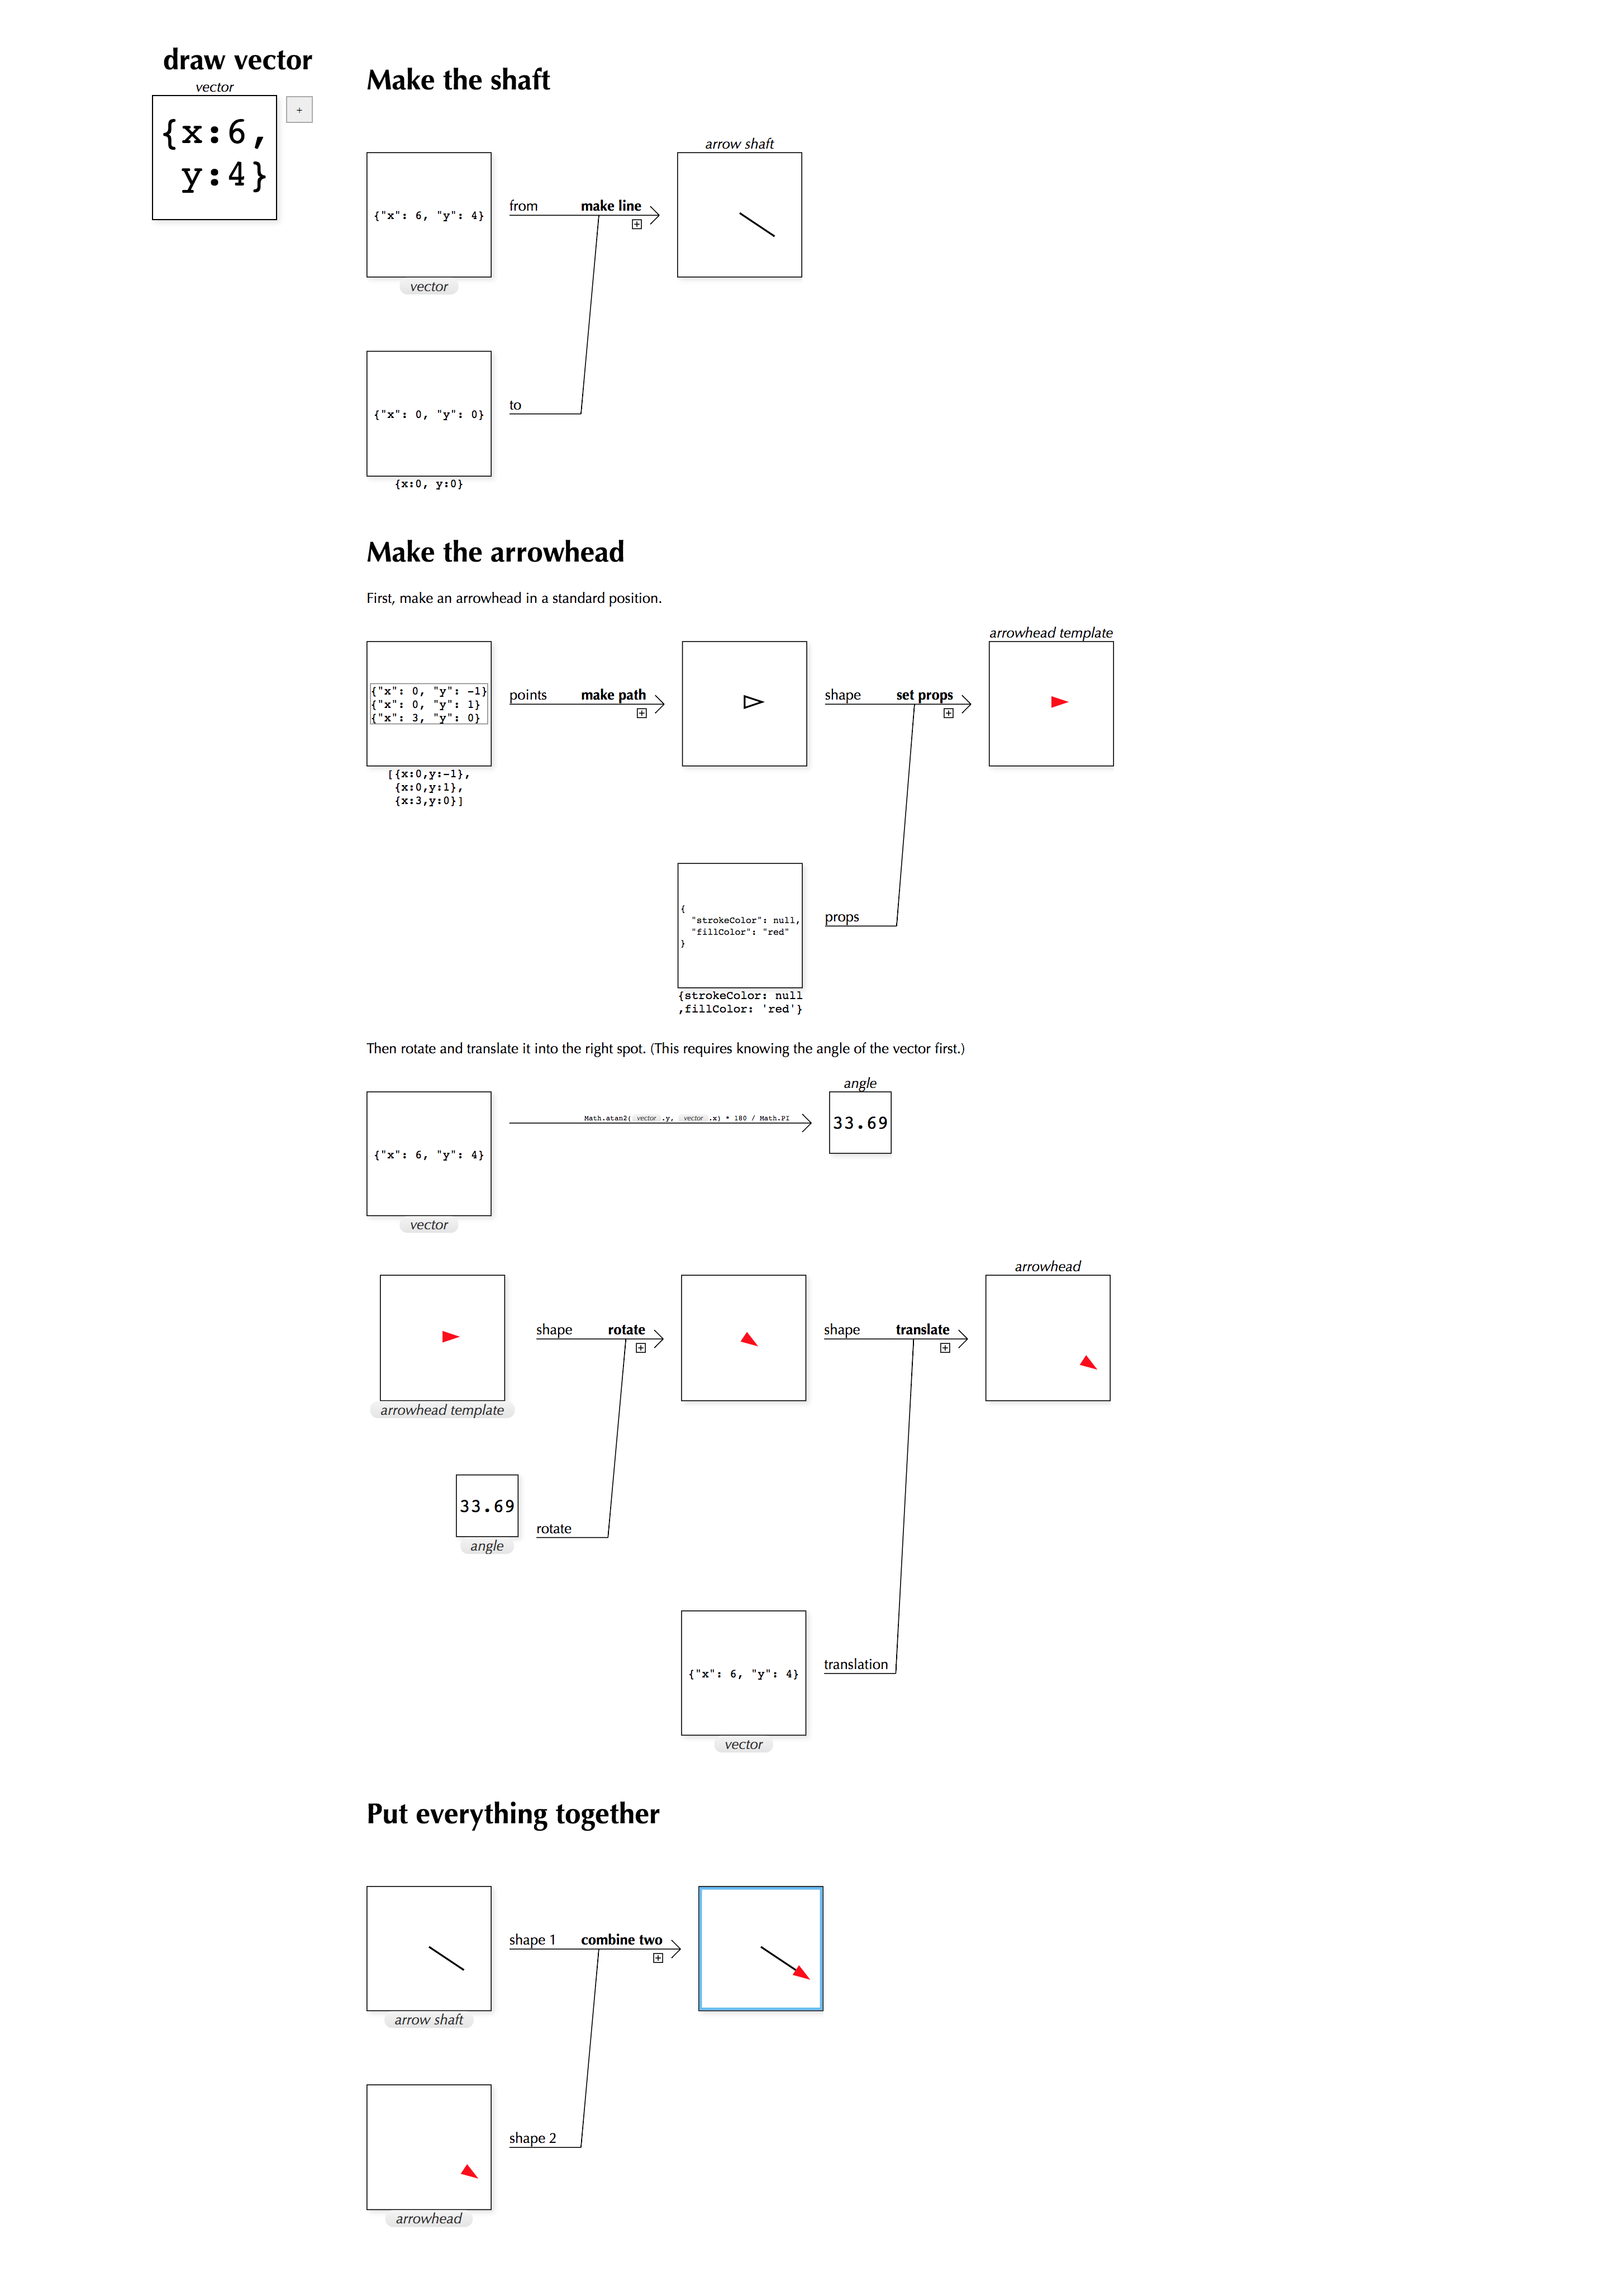
Once we wrap draw vector and set the wrapped version to be a visualizer, the normalize definition from the very beginning of this paper gets a whole new look:

As a final demonstration of the power of functional drawing (& automatic visualization of data), here is a PANE definition which produces a fractal triangle to the requested level of detail:

Related work
Node-based programming
PANE invites comparisons to node-based programming systems like Max/MSP and Quartz Composer. After all, PANE consists mostly of little boxes connected by oft-squiggly lines. But there are at least two significant points of departure.
The first is about data-centeredness. While most node-based programming environments represent functions as little boxes and values as invisible signals travelling along wires connecting the boxes, in PANE the priority is inverted. In PANE, values are represented as little boxes, and functions as labels on connectors. This inversion may seem unimportant, but it reflects the priority PANE places on data, and it has real effects on the feel of the system. Traditional node-based programming environments use an analogy of patching together signal-processing boxes with wires. This is, notably, an analogy to an environment where the signals travelling along the wires are invisible, unless a special “probe” box is attached. Correspondingly, node-based programming environments tend not to show the data flowing through the program by default. PANE makes this data visible, and makes it the main “handle” for editing the program.
The second is about design, layout, and structure. Rather than following node/patch-based interfaces’ single-minded commitment to representing a program as a web of boxes, PANE uses graphical elements to represent program structure only on a small scale, and only in a tightly structured way. Larger-scale structure instead follows a more traditional route, using a literate, document-based metaphor and often replacing noodle-connectors with names. Just because something is mathematically a graph doesn’t mean it should look like one – names can be edges too.
Data-visible live programming
PANE is very much inspired by the Subtext project, especially [Edwards 2015]. PANE shares with Subtext a commitment to bridging the gulf between the representation of a program and its execution. The main thing that can be said of their differences is that PANE is less radical, adapting conventional functional-programming concepts in a fairly straightforward way, while Subtext takes on programming more broadly and holistically.
Other like-minded projects include Flowsheets ([Chiacchieri 2017]), Substroke ([Victor 2007]), and the humble spreadsheet.
Future work
PANE is an early, theoretical prototype. It has much room to grow, in terms of both practical utility and research insights. We list here a few directions for work which seem to hold clear promise.
Practical improvements
Developing a tool requires intimate contact with its authentic use. For PANE to be a useful tool for research, past a certain early point, it must become a useful tool for programmers. Here are some straightforward steps which would bring it closer to this goal:
- Innumerable superficial interface improvements are needed, uninteresting from a research perspective but critically important. These include significant improvements in performance.
- PANE has the benefit of being embedded in JavaScript, a familiar language with a rich ecosystem of libraries and tools. If it takes advantage of this existing infrastructure in the right way, PANE will be able to focus on providing the best possible environment for the data-processing core of a programming task. Facilities should be built for PANE code to call JavaScript code and JavaScript code to call PANE code.
Data-directed programming
Although the programmer using PANE is deeply informed by the data they see flowing through their program, the PANE interface is mostly oblivious to it. PANE ought to make use of this data to guide the programmer in building their program.
- When a programmer selects a value, intending to make it the input to a call, PANE could search through all the definitions in the system to find which ones run without errors on that value. PANE could then present these definitions to the programmer as options. Here, data would determine compatibility, rather than types.
- Similarly, if a programer knows what value they want to produce from an existing value, but not what definition to use to get there, PANE could try out different definitions and offer up those that work. Perhaps PANE could even search through chains of functions, synthesizing small programs to connect the programmer with their destination.
Types
Despite the general skepticism of types implicit in much of the preceding discussion, the role of types in PANE remains to be seen. Programmer-specified types have the potential to help organize and assist the programmer’s work, as long as they know how to stay out of the programmer’s way when not needed.
A concept that arose early in the development of PANE but which has not yet been deeply explored is that of “recognized types”. A “recognized type” is a type which a programmer defines via a predicate that runs on data. For instance, a programmer might specify that there is a type called “vector”, and that a piece of data is a vector if it has numerical x and y fields. The association of this type with a node can automaticlly be detected by looking at the values the node takes on. Then this type could be used to guide visualization of the value, calls that might be appropriate, and alternative values to try (in the case of function inputs). There may in fact be a synergy between data-visibility and some sort of typing.
Imperative programming
PANE is designed around functional programming because of that style’s special potential to support data-visible programming. But the fact remains that many data-processing algorithms become simpler or more direct when viewed as imperative processes which mutate data structures in-place. Fortunately, projects like Seymour ([Kasibatla and Warth 2017]) point to powerful visualizations for imperative processes. It remains an open question how PANE could be extended to allow imperative programming, and what might be gained by doing so.
Relational, contextual, and interactive visualizations
The visualizations feature currently implemented in PANE puts each value’s visualization in the value’s box. This means each visualization lives in its own little world. But some of the most powerful uses of visualization involve combining multiple pieces of information in the same space. Looking at visualizations in isolation makes it hard to answer questions like: How does one time series compare to another? or: Do two regions of the plane overlap? PANE would likely benefit from giving visualizations a way to mingle.
Furthermore, a visualizer in PANE either turns a piece of data into a visualization or not, without regard to the data’s context or the programmer’s interactions. The question of whether a piece of data is best represented by a given visualization is often complex. At the very least, PANE should give the programmer control over what they are seeing.
Last but not least, PANE only has support for non-interactive visualizations. It will render an {x, y} pair as a nice juicy vector, but won’t let the programmer grab onto the vector and spin it around. Something should be done about this.
Hetrogeneous live programming
PANE aspires to be a capable tool for general-purpose data processing. However, it will never be the best tool for certain jobs. For instance, although PANE is likely to be superior to traditional coding for the task of making visualizations, it is not as suited to the task as something like Apparatus ([Schachman 2015]). (Apparatus gives the programmer a bonafide canvas for laying out the pieces of a diagram, alongside a set of powerful programming primitives tailor-made for the needs of diagram-builders.)
So a programmer needing a visualization for PANE should be able to draw it in Apparatus. And a programmer needing a data-processing routine for their Apparatus diagram should be able to make it in PANE.
Alternative programming tools might thrive in an ecosystem where they can lean on each other’s strengths.